Posts

The economics zeitgeist, 30 May 2010

Image
This week's word cloud from the economics blogs. I generate a new cloud every Sunday, so please subscribe using the RSS or email box on the right and you'll get a message every week with the new cloud. The words moving up and down the chart are listed here . I summarise around four hundred blogs through their RSS feeds. Thanks in particular to the Palgrave Econolog who have an excellent database of economics blogs; I have also added a number of blogs that are not on their list. Contact me if you'd like to make sure yours is included too. I use Wordle to generate the image, the ROME RSS reader to download the RSS feeds, and Java software from Inon to process the data. You can also see the Java version in the Wordle gallery . If anyone would like a copy of the underlying data used to generate these clouds, or if you would like to see a version with consistent colour and typeface to make week-to-week comparison easier, please get in touch.
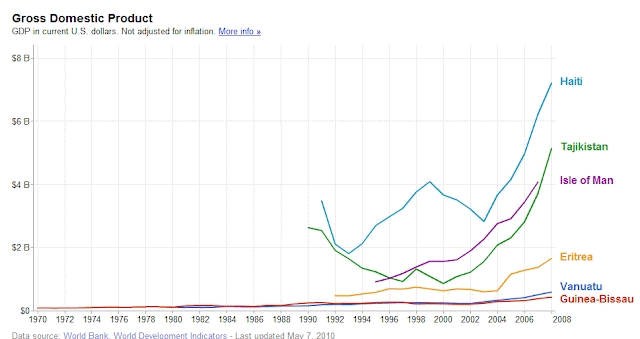

Google GDP

Image
There's no specific point to this picture - feel free to draw your own conclusions. It comes from a neat feature from Google, which I suspect has been around for a while if I'd looked for it earlier. Here's the link if you want to play.

HIPerbolic discounting

Latest in my series of bad puns on the word "hyperbolic". HIPs are being scrapped by the new government. This will provide relief to millions of annoyed estate agents ad house sellers everywhere. But why? HIPs should be a gift from the economics profession which is joyfully accepted by buyers, sellers and agents. The reason? Because houses are a classic " market for lemons ". A simple explanation of what this means and what the consequences are: The seller of a house knows much more about it than the buyer. Therefore, if the seller thinks it is worth £200,000, a buyer should apply a discount to take account of the risk that something is wrong. Let's say they apply a 10% discount and offer £180,000. After the discount, some sellers who do not  have anything wrong with their house will prefer to stay rather than sell for less than it's worth. Other sellers, who do have a skeleton in the cupboard, will keep their house on the market. The average quality...

Do we ever make ANY difference at all?

This fascinating analysis from Tino Sanandaji (via Marginal Revolution) reveals an unexpected (to me) fact about the Japanese "lost decade(s)". Japan's growth from 1990 to 2007, adjusting for changes in demographic composition of the population, was exactly the same  as the US and Europe's! So for all the attention on the US technology boom, European integration, Japan's property bust and vast stimulus programmes - none of it mattered. Growth per working-age individual seems to proceed at a steady 1.6% per annum regardless of the different policy regimes, tax rates, interest rates etc etc etc. This sheds interesting light on the claim of Adam Posen (Bank of England monetary policy committee member) that Britain faces a Japan-style decade. So does the surprising fact that the UK was the leader among all rich countries in total factor productivity growth from 1990 to 2007! So is all of economic growth explained by some common underlying factor, unrelated t...

Economic flexibility or urban blight?

Having questioned the flexibility of the British economy in my last post , I came across an article which made me wonder the same about America: ...the city took a marked turn for the worse. We passed vacant lots surrounded by listing barbed-wire fences, the shells of abandoned mini-malls and the cement outlines of what might once have been petrol stations, now being reclaimed by bushes and grass. There were lots of these ‘urban fields’, where buildings had been torn down and nothing built in their place, and it was curiously unsettling to see how easily sizable chunks of a city could be erased and swallowed up once humans left. ...the neighbourhood reached its nadir – no small feat – with boarded-up houses, a couple of burned-out shops being used as squats, a low, forbidding bar called ‘Club Rolex’ and, saddest of all, the brick skeleton of what had been George Rogers Clark Junior High School. It stood like the shell of a dissolved monastery behind a high wire fence in an asphalt...

How's the UK economy doing?

Some news has been creeping in which gives us a picture of the British economy that's gradually becoming clearer. First, from the ONS via David Smith : Business investment for the first quarter of 2010 is estimated to be 6.0 per cent higher than the previous quarter. From the same source, some news on public borrowing: ...in December, the Treasury preducted public sector net borrowing for 2009-10 of £178 billion on the definition it uses. The latest figures from the Office for National Statistics show a downward revision to the outturn, taking it to £156 billion...At one time people were predicting figures as high as £220 billion. Recent growth estimates are decent (though not outstanding) too: Gross Domestic Product (GDP) increased 0.2 per cent in the first quarter of 2010, compared with an increase of 0.4 per cent in the previous quarter. There was a concern prior to the release that growth might be negative, due to heavy snow in January and February. So growth of 0.2%, thou...

The economics zeitgeist, 23 May 2010

Image
This week's word cloud from the economics blogs. I generate a new cloud every Sunday, so please subscribe using the RSS or email box on the right and you'll get a message every week with the new cloud. The words moving up and down the chart are listed here . I summarise around four hundred blogs through their RSS feeds. Thanks in particular to the Palgrave Econolog who have an excellent database of economics blogs; I have also added a number of blogs that are not on their list. Contact me if you'd like to make sure yours is included too. I use Wordle to generate the image, the ROME RSS reader to download the RSS feeds, and Java software from Inon to process the data. You can also see the Java version in the Wordle gallery . If anyone would like a copy of the underlying data used to generate these clouds, or if you would like to see a version with consistent colour and typeface to make week-to-week comparison easier, please get in touch.